Population Vs Sample
Popluation
The collections of all items of interest to our study obtained through various
measurements; denoted N.
Almost impossible to perform analysis on large populations.
Parameter: A numerical value describing an aspect of an entire population
Sample
A subset of the population of interest; denoted n.
Statistics: A numerical value describing an aspect of a Sample
Parameters can be obtained by doing statistics on their samples, if more samples of a
population is available then the parameter values will be more accurate.
Random Sample
A sample where each member is chosen from the population strictly by chance, which is the ideal sample from a population and can give a more accurate results for the population if the random sample can charatcterise all the variables of the population.
Parameter vs statistics
The .table-striped class adds zebra-stripes to a table:
| Parameter | Statistics |
|---|---|
| Parameters are numbers that summarize data for an entire population. | Statistics are numbers that summarize data from a sample, i.e. some subset of the entire population. |
| Examples | Parameter/Statistics |
|---|---|
| e.g A researcher wants to estimate the average height of women aged 20 years or older. From a simple random sample of 45 women, the researcher obtains a sample mean height of 63.9 inches. |
Parameter: The parameter is the average height of all women aged 20 years or older.
Statistic: The statistic is the average height of 63.9 inches from the sample of 45 women. |
| e.g A school administrator wants to estimate the mean score on the verbal portion of the SAT for students whose first language is not English. From a simple random sample of 20 students whose first language is not English, the administrator obtains a sample mean SAT verbal score of 458. |
Parameter: The parameter is the mean verbal SAT score for students whose first language is not English.
Statistic: The statistic is the mean SAT verbal score of 458 from the sample of 20 students. |
Infering a population from a sample:
We use statistics to infer the population parameters. Each samples would provide a different mean called sampling variation using which we form a distribution called Sampling distribution This means if our distribution follows the normal distribution we can find the standard deviation of the sampling distribution(sample means) which is the Standard error of the mean (SE).
- Normal Distributions: Bell-shaped curve, with the values spread equally across the mean of the variable.
- Skewed:
When the data points cluster more toward one side of the scale than the other,
creating a curve that is not symmetrical. It could be both positively skewed or negatively
skewed.
- Positively skewed:When the data points cluster towards the left leading a tail on the right.It means that the outliers are to the right (long tail to the right).
- Negatively skewed:When the data points cluster towards the right leading a tail on the left. It means that the outliers are to the left.
- Kurtosis:It shows the heaviness of the tail,which can be divided as Leptokurtic = heavy tails (more scores in the tails), Platykurtic = light tails (more scores in the middle).
If the bell curve is sharp, it implies that the spread/deviation is less and the population mean is more closer to the sampling mean.
Standard Normal: If the mean of the normal distribution is 0 and the standard deviation is 1 then it is said to be Standard Normal.
The distribution of sample statistics is nearly normal,centered at the population mean, and with a standard deviation equal to the population standard deviation divided by square root of the sample size.
Conditions for CLT:
- Independence:Sampled observations must be independent; random sample
- Sample size/skew:Either the population distribution is normal,or if the population distribution is skewed,the sample size is large (rule of thumb:n > 30).
A plausible range of values for the population parameter is called a confidence interval.
Note:
If we report a point estimate,we probably won’t hit the exact population parameter.
If we report a range of plausible values we have a good shot at capturing the parameter.
Standardized score to compare the probability of getting values in our measurement scale
to standard normal.
For each raw scores, calculate how far it is from the mean in the units of S.D.
Distribution of Z-score is standard normal(i.e.) Mean =0, SD = 1
- Comparing Scores on different raw score scales.
- Showing how a given score stands in relation to overall set of scores.
- Using probability tables to calculate the likelihood of particular scores.
- 95% of z-scores lie between -1.96 to +1.96
- 99% of z-scores lie between -2.58 to +2.58
- 99.9% of z-scores lie between -3.29 to +3.29
"Critical" values of z are associated with interesting central areas under the standard normal curve. The area under the curve between the critical points implies the probability that any normal variable will have z-score between the said points. The critical value of z is term linked to the area under the standard normal model. Critical values can tell you what probability any particular variable will have. Critical z values are often denoted by zα, where the subscript α (alpha) is the tail area.
Representative Sample:
A representative sample is a subset of a population that seeks to accurately reflect the characteristics
of the larger group.
A representative sample is a small subset group that seeks to proportionally reflect
specified characteristics exemplified in a target population.
Representative samples often yield the best results but they can be the most difficult
type of sample to obtain.
When a sample is not representative, it can be known as a random sample. While random sampling
is a simplified sampling approach, it comes with a higher risk of sampling error which can
potentially lead to incorrect results or strategies that can be costly. Random sampling can
choose its components completely at random, such as choosing names randomly from a list.
Key issues with Samples
- Biased Sampling: One of the most important issue with Sampling is Biased Sampling, which produces data that systematically differs from the population from which it is taken. This could degrade the integrity of the population parameter
- Sample size:Which means the size of the sample subset from the population,
If the size is small, it might create problems when extrapolating conclusions for the population
If the size is large, it may lead to waste of resource, since a smaller sample could get the necessary conclusions - Randomness:Each variable/feature in the data should be as random as possible, with/without the researcher's knowledge it is possible to introduce bias in the sample
Experiments and Variable
Experiments:The process using which we collect relevant measurements for statistics
Variable/Features:An attribute that describes a person, place,
thing, situation, or idea.
The variables in the study/experiment should be reliable and valid.
Confounding Variables: Sometimes, it is pssible that the sample contains
values which are influenced by other measurements which we included in the sample.
These are called confounding variables.
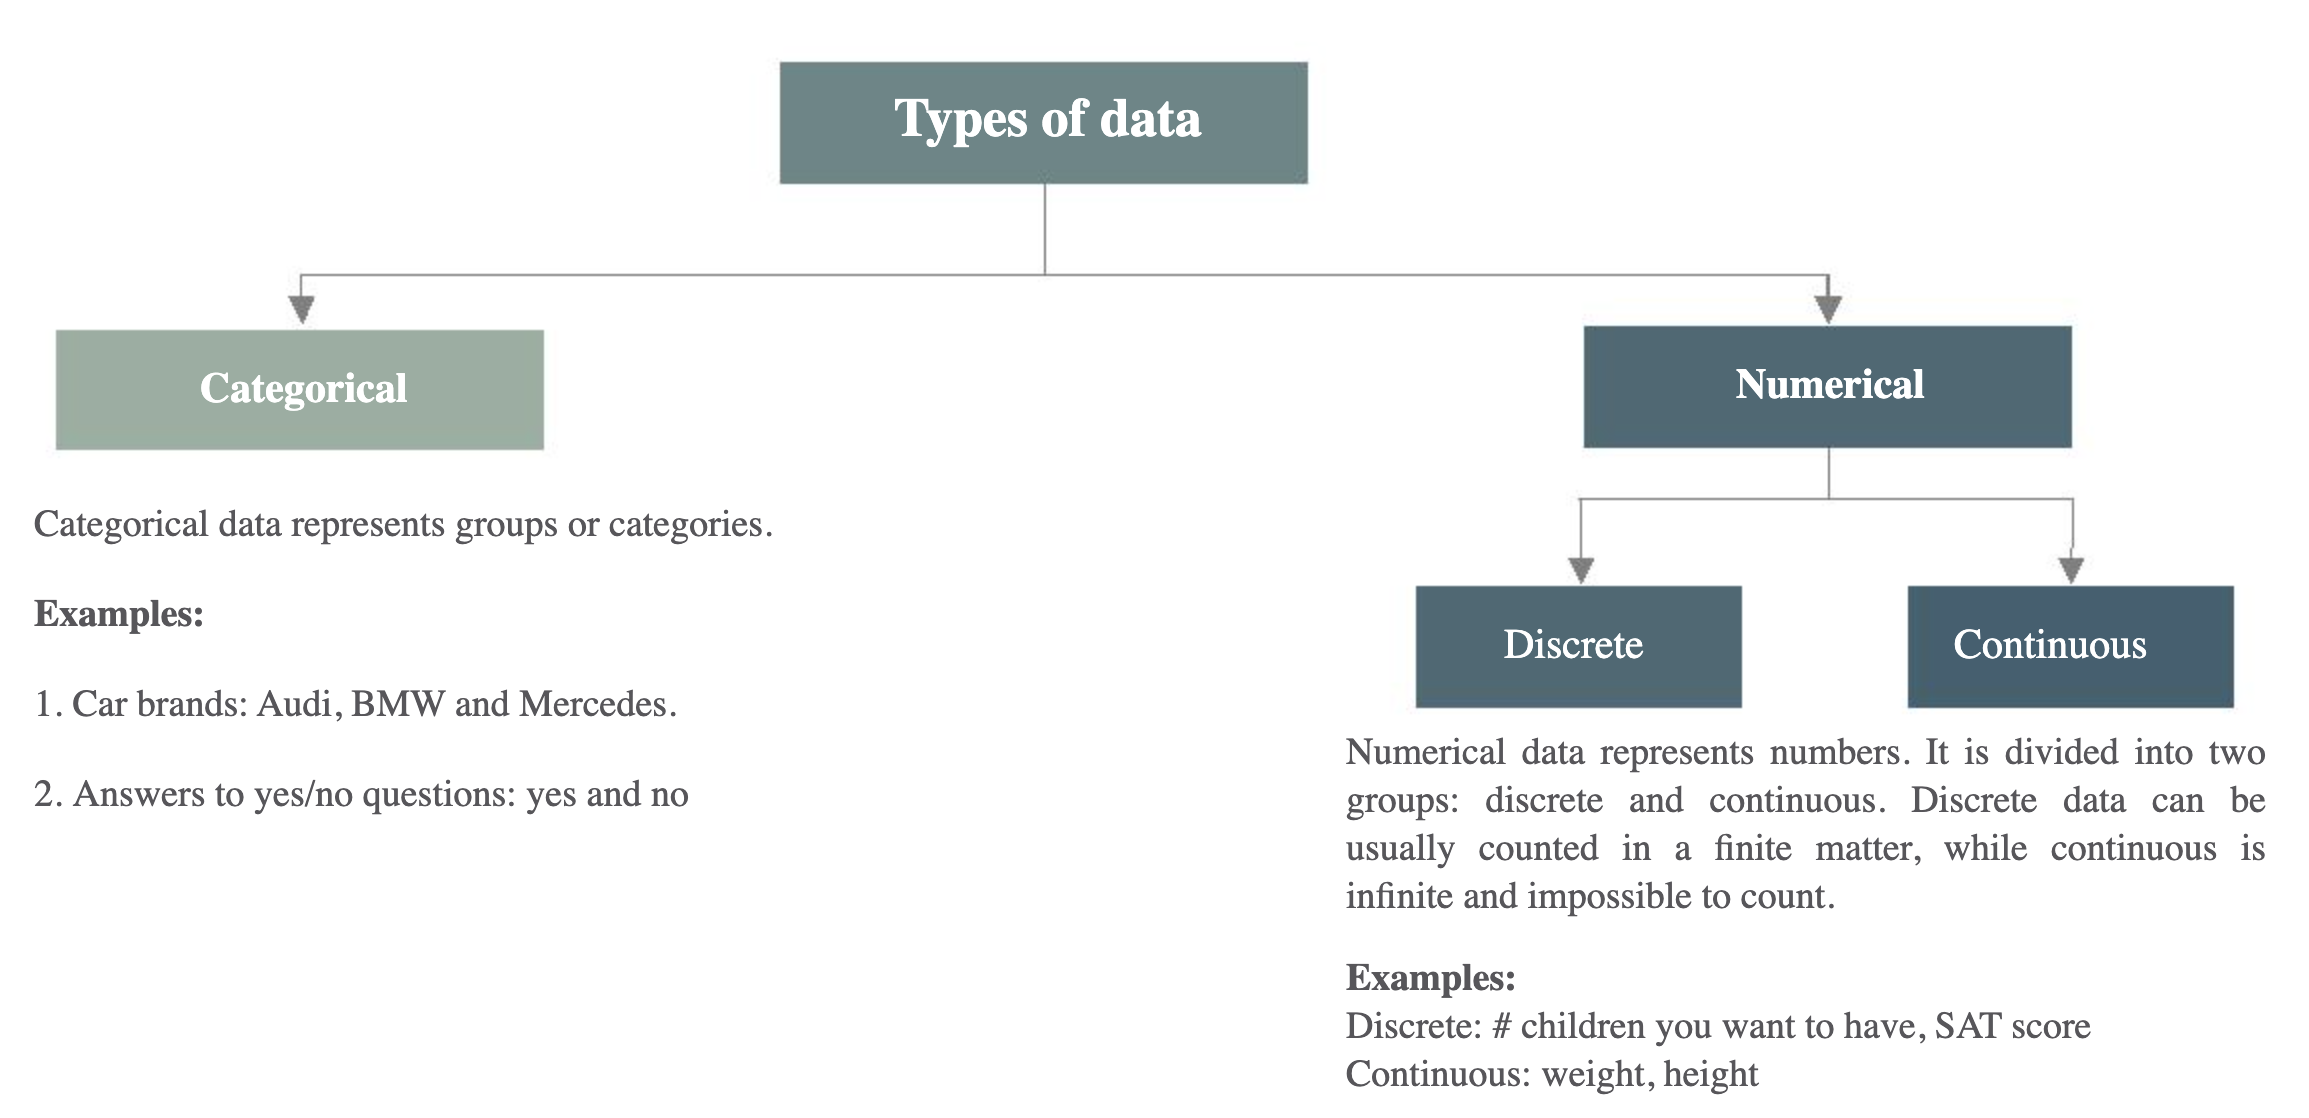
Types of Data
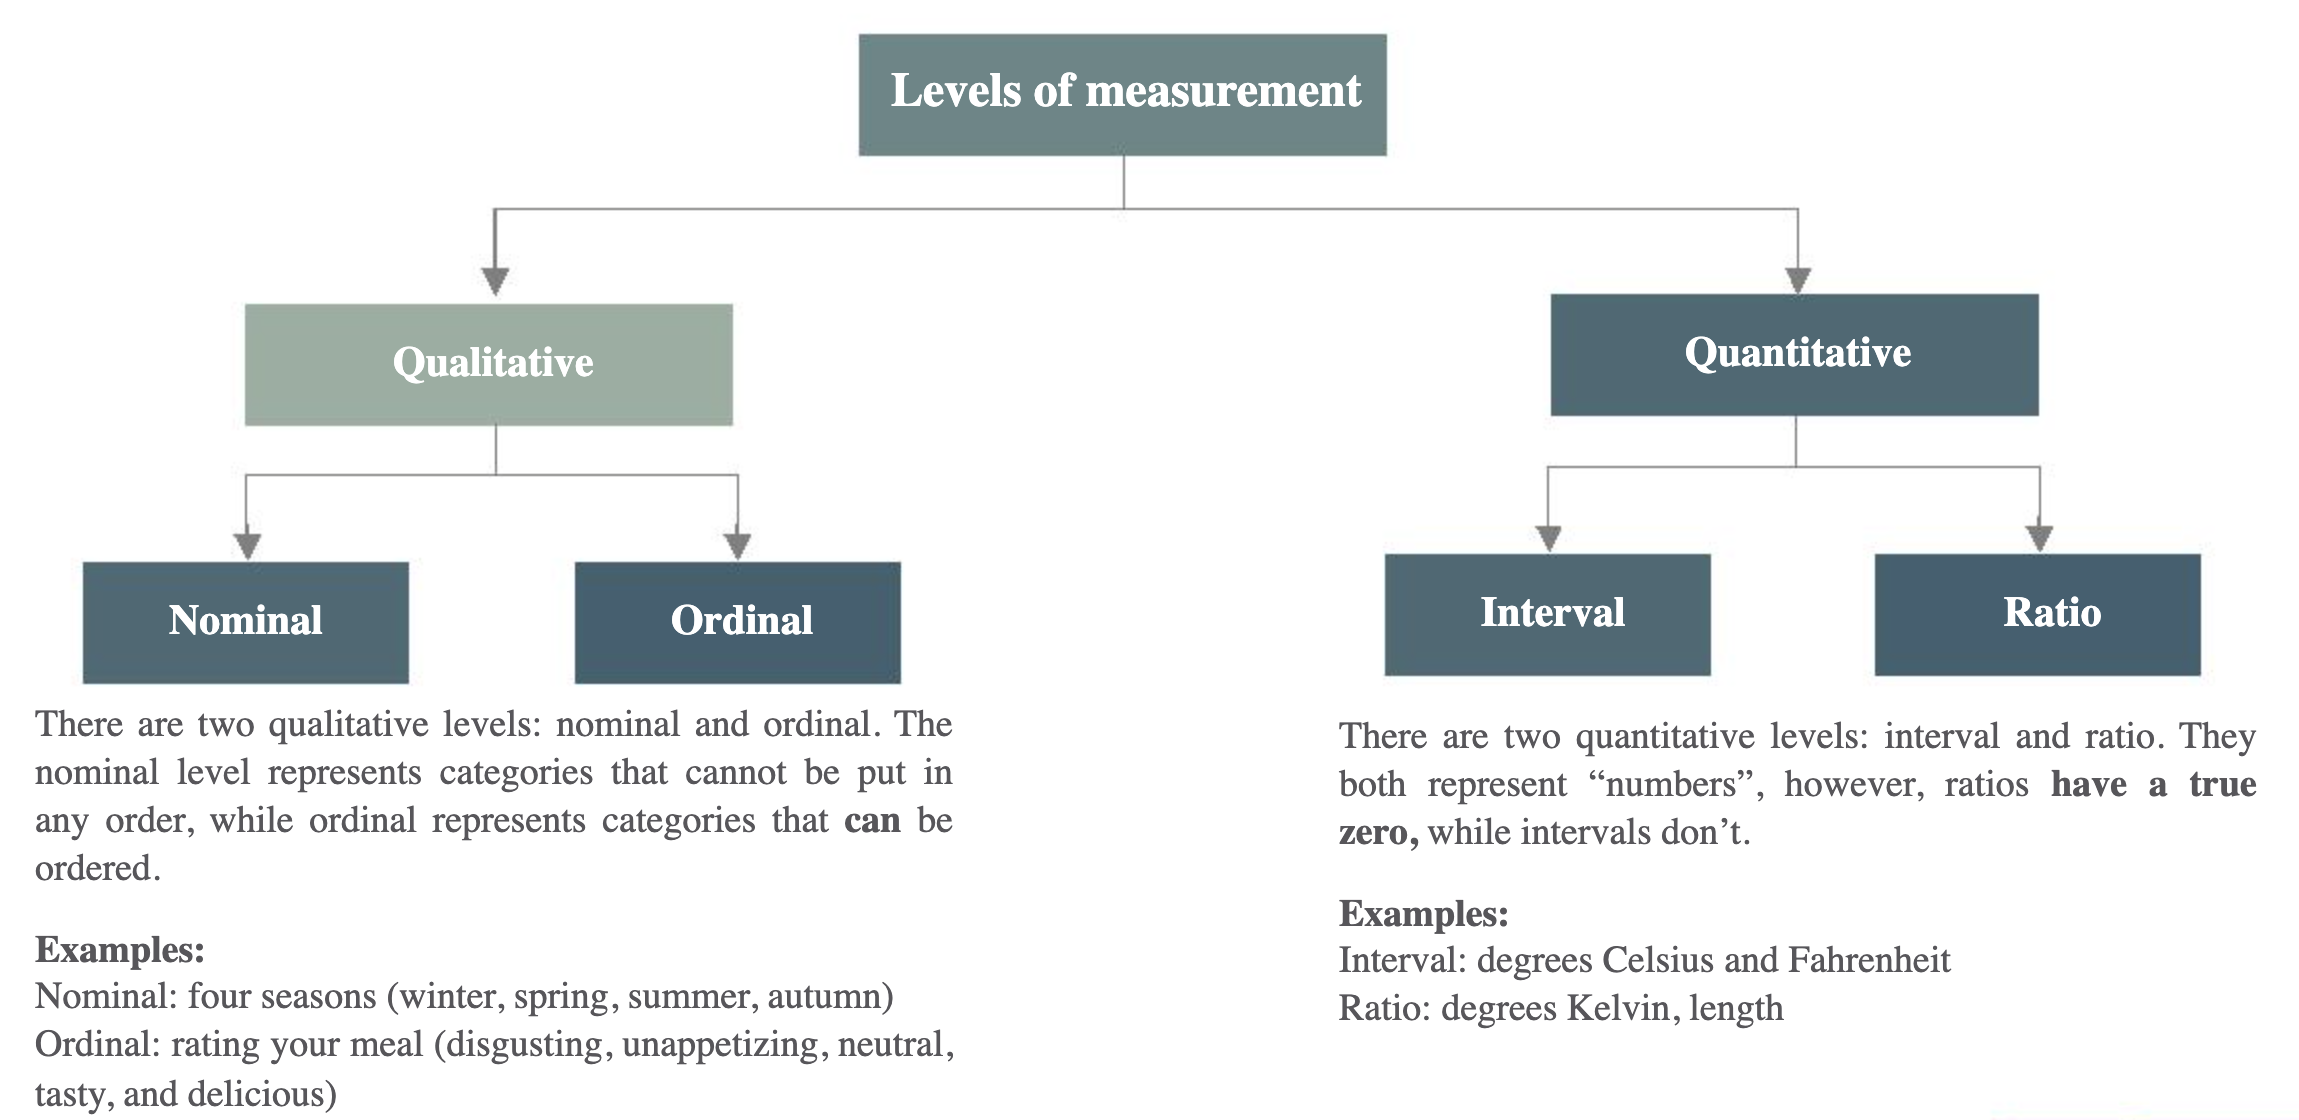
Levels of measurements
Hypothesis Testing:
A statistical method that uses sample data to evaluate a hypothesis about a population parameter. It is intended to help researchers differentiate between real and random patterns in the data.
Types of Hypothesis testing:- Null Hypothesis(H0):
It is a statemment regarding the values of unknown parameter, typically implies no association between independent and dependent variables in out theory.
All hypothesis testing starts with the null hypothesis.
Usually check for equality. - Alternate Hypothesis(Ha):
Contradicting Null hypothesis, seeking evidence against H0;
Usually checks for non-equality. - Test Statistic:
A quantity based on the sample data and null hypothesis which allows us to determine between null and alternate hypothesis
If we again think of a hypothesis test as a criminal trial then it makes sense to
frame the verdict in terms of the null and alternative hypotheses:
H0 :Defendant is innocent
HA :Defendant is guilty
Steps Invovled in Hypothesis testing
- Compute Test Statistic (or compute P value)
- Search for Critical Value
- Make Statistical Decision rule
- Express Decision
– If p value >= alpha, Do Not Reject H0
– If p value < alpha, Reject H0
Understanding the dataset: Student Performance Dataset
Overview:
This dataset is about student achievement in secondary education of two Portuguese schools.
The features include student grades, demographic, social and school-related features)
and it was collected by using school reports and questionnaires.
- Size of the dataset: 382 records
- Representativeness of the dataset:
The dataset uses the data of students achievement in secondary educattion but focusing on only two schools. Though it is not completely random rather focuses on the characteristics of the students involved in the dataset.
So this sample, cannot extend to provide the population parameter.
- Missing Data:
- It can reduce the representativeness of the samples.
- Missing data affects the validity of statistical analysis and can lead to invalid conclusions.
- It can occur due to errors, mistakes, or lack of foresight by the researcher or problems outside the control of the researcher
- Sometimes it can be deliberate added to change the statistics of the sample.
- “Real” missing data can seldom be classified into just one of the three (MCAR- Missing completely at Random, MAR- Missing At Random, MNAR- Missing Not At Random)
- Based on the Dataset:
- In our case, there are no missing data at first glance.
- But on a closer look we can see some values are 0, this maybe caused due to several factors which include student absent during the exam.
- Since the percentage of these values for our variables of interest are very less, we will ignore it.
- Other methods of solving this problem may include imputing in which we impute the mean value of the column to these missing values.
Code:na_count <-lapply(s_perform, function(y) round((sum(length(which(y==0))))/length(y)*100))
na_count <- data.frame(na_count)
na_countResult:> na_count school sex age address famsize Pstatus Medu Fedu Mjob Fjob reason nursery internet guardian.m traveltime.m 1 0 0 0 0 0 0 1 1 0 0 0 0 0 0 0 studytime.m failures.m schoolsup.m famsup.m paid.m activities.m higher.m romantic.m famrel.m freetime.m 1 0 83 0 0 0 0 0 0 0 0 goout.m Dalc.m Walc.m health.m absences.m mG1 mG2 mG3 guardian.p traveltime.p studytime.p failures.p 1 0 0 0 0 30 0 3 10 0 0 0 91 schoolsup.p famsup.p paid.p activities.p higher.p romantic.p famrel.p freetime.p goout.p Dalc.p Walc.p 1 0 0 0 0 0 0 0 0 0 0 0 health.p absences.p pG1 pG2 pG3 1 0 39 0 0 1 - Concepts of Interest:
- Sample
- Statiscal Measures
- Missing Values
- Normal Distribution
- Confidence Interval
- Z-score
- Data types
- Correlation.
- Hypothesis testing
- Variables of Interest:
The dataset contains details about the various factors that could possibly affect a students performance. Some of the variables that I'm interested in are:
- studytime:How much effort the student puts in.(Ordinal: 1 - < 2 hours, 2 - 2 to 5 hours, 3 - 5 to 10 hours, or 4 - >10 hours)
- familysup:Support from family may or may not have some effect (Nominal: yes or no)
- higher:Student's interest for higher studies (Nominal: yes or no)
- internet:Does the student have internet connection? (Nominal: yes or no)
- romantic:Is there any romantic relationship (binary: yes or no)
- mg1,mg2Maths first,second period grade.(continous(interval): 0to 20)
Research Questions:
- Question:1 Is there a Relationship between mG2 and mG3?
- Question:2 Is there a Relationship between mG3 and students trying for higher education?
- Question:3 Is there a Relationship between mG3 and their study-time?
- Question:4 Is there a difference between students with different family size(less than 3 and greater than 3) in terms of whether they get family support?
- Question:5 Can we predict mG3 value with various predictors using linear Regression ?
- Question:6 Can we predict whether a student will go for higher studies(higher.m) with various predictors using logistic Regression ?
- Question:7 Can we do dimension reduction for the "studentpIusepersonality" dataset ?